The Los Angeles Fires 2025
 Image attribution CC BY-SA 4.0, via Wikimedia Commons
The Los Angeles wildfires in January 2025 devasted our city including many at JPL. It’s a hazard that many on the OPERA team were personally impacted. Due to it’s felt proximity, we were eager to see how well the DIST-S1 product fared. The OPERA DIST-S1 product provides disturbance alerts and accumulates changes over time. It is far from perfect, but it is able to provide all-weather, all-illumination observations. We will see how the burn areas faired against hand drawn maps. We will also see how the changes accumulated evolved over time.
Status Layer
Let’s first examine what the product looks like 2 months after the fire.
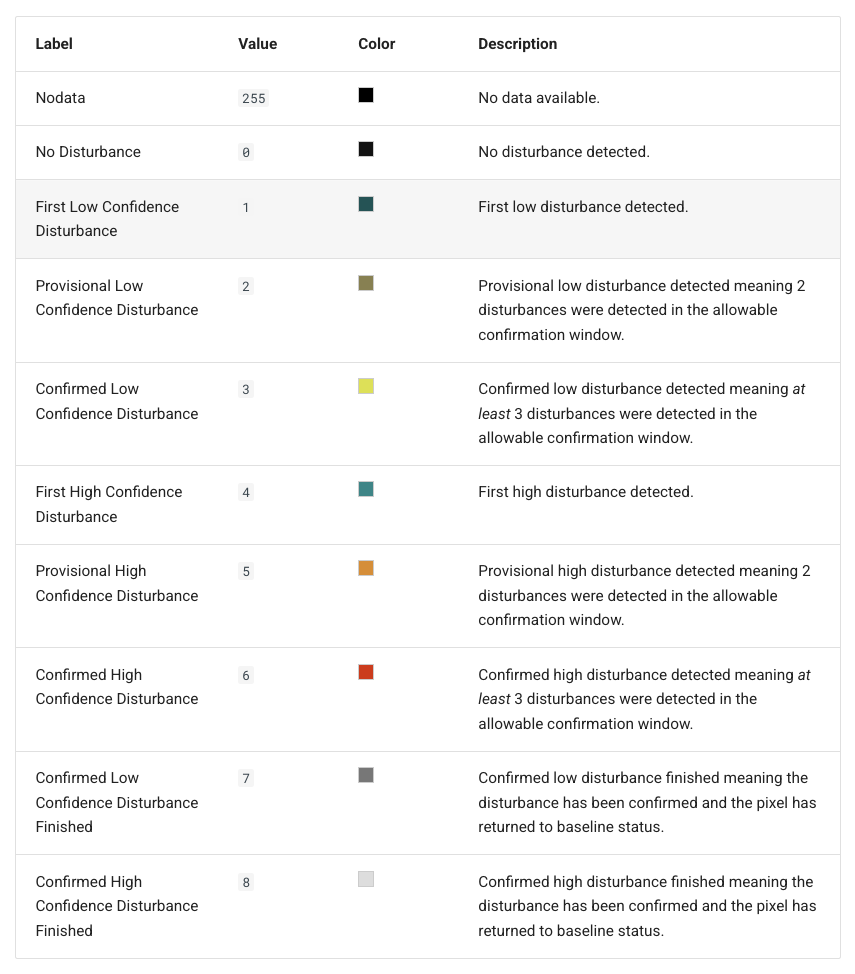
The most representative layer is the DIST-GEN-STATUS layer, which represents the disturbance delineations detected by our product.
A description of this layer, it’s labels, and color map can be found here:
We overlay the perimeters extracted from the Wildland Fire Interagency Geospatial Services, a massive database of burn perimeters within the United States. To get all the relevant perimeters (Eaton, Pallisades, Kenneth, Sunset), we examined +/- 20 days from January 4th, 2025 within MGRS tile 11SLT. Again, the status layer shown is actually 2 months after the event. This allows us to see the full burn area and the accumulated changes detected by the product.
It’s also helpful to see how the status layers change over time and what to expect. Los Angeles is well represented by Sentinel-1 imaging, meaning that the available images are released by the European Space Agency (ESA) and we can process them. In the time-series below, you often see images taken twice in 1 day because there is an ascending and descending track over LA.
For example, SAR is highly sensitive to rain. Los Angeles had an unusually wet February including an atmospheric river on Feburary 14th on 2024. You can see erroneous changes associated to this that are marked as alert/provisional signal and then are removed over time with confirmation process.
Eaton Fire Zoom In
Let’s take a closer look at the Eaton Fire with additional external data layers including damage indicators and as well as the DIST-S1 metric. The Damage Inspection (DINS) data from CalFire (here are the links for the complete CA DINS database and just for Eaton). One thing to note is that the status layer confirms/accumulates changes through all viewing geometries and over time. Our confirmed layers do not capture the entire burn perimeter. However, if we look at the metric (coming from January 21st), we can see good visual alignment with the DINS data. The metric is a way to quantitatively measure how disturbed a pixel is. Higher values indicate higher statistical likelihood of disturbance and lower, less. Visually, we scaled the metric to be between 2 and 5, so that values below 2 are set to the visual min (blue) and values above 5 are set to the visual max (yellow).